Fiscal Responsibility
The 800-pound gorilla in the room is our soaring federal debt.
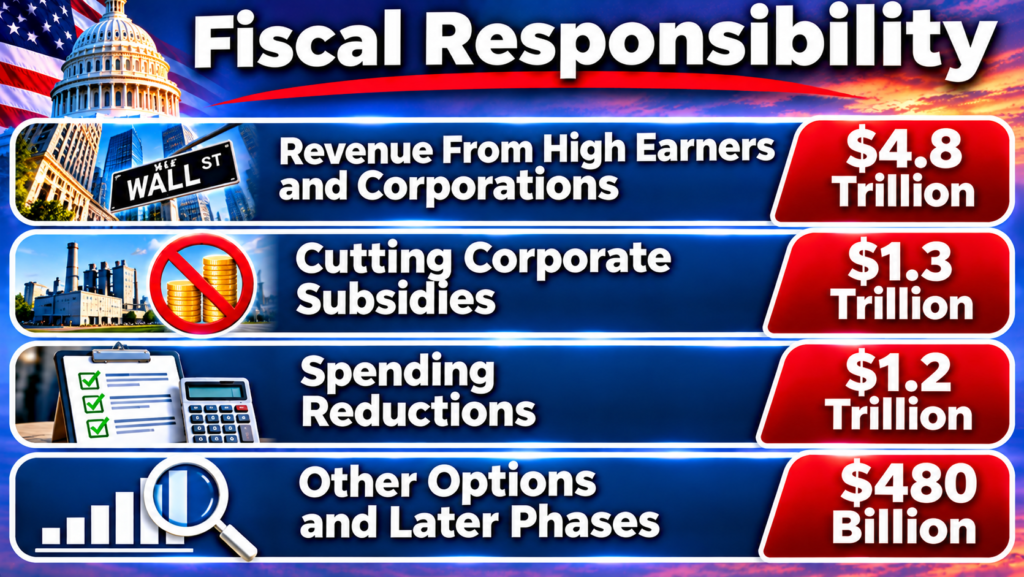
Bottom line: The United States can balance its budget by about 2045 without raising taxes on, or cutting programs for, lower-income households. Doing so takes about $12 trillion in policy changes over the next decade, drawn mainly from high earners, corporations, corporate subsidies and defense, plus about $1.5 trillion in lower interest costs. Within ten years, the plan cuts the deficit from a projected 6.9% of GDP to about 1.3% and puts debt on a steady downward path.
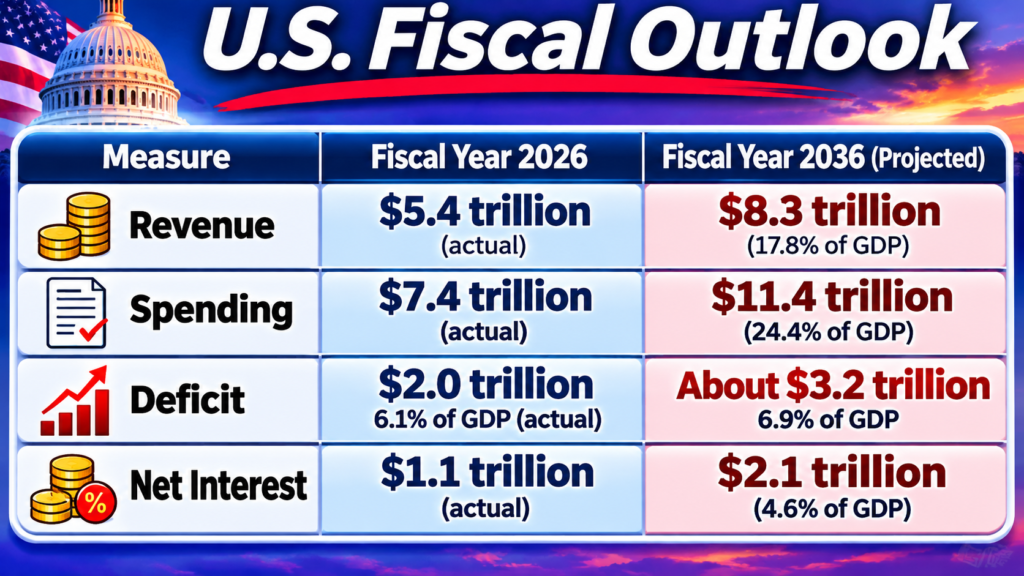
The problem. The government ran a $2.0 trillion deficit in fiscal year 2026, and interest on the debt, $1.1 trillion, now consumes about 19% of all federal revenue. After the Supreme Court struck down the IEEPA tariffs, the Congressional Budget Office’s projections imply deficits of about $25.5 trillion from 2027 to 2036, with debt reaching roughly 124% of GDP.
The plan, in three phases
| Phase | Main measures | 10-year savings (2027 to 2036) |
| 1. Start now (2027) | Higher taxes on income over $1 million, capital gains at death and wages over $250,000; a 28% corporate rate; ending Medicare Advantage overpayments and fossil fuel breaks; a leaner defense budget; tax enforcement | $7.3 trillion |
| 2. Broaden (from 2030) | Further defense savings; a 1.5-point surtax on income above $100,000 single or $200,000 married; limits on tax breaks used mainly by upper-income households | $2.9 trillion |
| 3. Finish (from 2033) | A menu sized to about 2% of GDP: a carbon fee with rebates for lower-income households, a minimum tax on billionaires, higher Medicare premiums and slower benefit growth for high-income retirees, health care price reform | $1.8 trillion in the first four years |
| Interest savings | Lower debt means lower interest payments | About $1.5 trillion |
Specifics
High earners: $3.1 trillion
| Option | Who pays | 10-year revenue |
| Apply the payroll tax to wages above $250,000, without adding benefits | Workers with wages over $250,000 | $1,600 billion |
| Tax unrealized capital gains at death | Heirs of large estates | $570 billion |
| Extend the 3.8% net investment income tax to active business income of high earners | Owners of large pass-through businesses | $440 billion |
| A 40% rate on income above $1 million | About 650,000 taxpayers | $400 billion |
| Raise capital gains and dividend rates by 2 points | Mostly top 1% | $110 billion |
| Tax carried interest as ordinary income | Private equity and hedge fund managers | $15 billion |
The payroll measure does the most work. Today, Social Security tax stops at $184,500 of wages, so a worker earning $2 million pays the same Social Security tax as one earning $184,500. Applying the 12.4% tax again above $250,000 also strengthens Social Security’s finances. Taxing capital gains at death closes the largest single loophole for inherited wealth: under current law, decades of gains on stocks or property are never taxed if held until death. An exemption for family farms and small businesses would cost some of the $570 billion.
Corporations: $1.7 trillion
| Option | 10-year revenue |
| Raise the corporate rate from 21% to 28% | About $980 billion |
| Tax foreign profits at the full domestic rate | $345 billion |
| Raise the excise tax on stock buybacks from 1% to 4% | $246 billion |
| Repeal last-in, first-out (LIFO) inventory accounting | $105 billion |
A 28% corporate rate would still sit well below the 35% rate in place before 2018. CBO estimates each percentage point raises about $140 billion over ten years; the $980 billion figure scales that estimate to seven points. Taxing foreign profits at the full rate removes the incentive to book profits in low-tax countries, and a higher buyback tax treats share repurchases more like dividends.
Estimates are 10-year figures from CBO (via the Committee for a Responsible Federal Budget), the Budget Lab at Yale and the Penn Wharton Budget Model. Most CBO options were scored for 2026 to 2035 before the 2025 tax law; combined, some options overlap, so the true total could be somewhat lower.
3. Cutting Corporate Subsidies: $1.3 Trillion
Some of the most defensible savings come from payments and tax breaks that flow to profitable industries without a clear public return.
| Subsidy | Reform | 10-year savings |
| Medicare Advantage overpayments | Fully adjust for “upcoding,” where insurers record more diagnoses than traditional Medicare would, raising payments without better care | About $1,000 billion (of up to $1,320 billion) |
| Hospital facility fees | Pay the same rate for routine outpatient services whether delivered in a hospital-owned clinic or an independent doctor’s office (“site-neutral” payment) | $180 billion |
| Oil and gas tax preferences | Repeal special rules for foreign tax credits, percentage depletion and expensing of drilling costs | About $110 billion |
| Crop insurance | Lower the federal share of premiums from about 60% to 40% and cap insurer administrative payments and profits | $47 billion |
Medicare Advantage is the largest target. Private insurers are paid more per enrollee than traditional Medicare would spend, largely because of coding practices. CBO estimates raising the coding adjustment from 5.9% to 20% would save $1.32 trillion; this plan assumes about $1.0 trillion in Phase 1, with protections for special plans that serve people eligible for both Medicare and Medicaid, and the rest in Phase 2. Lower payments may trim some extra benefits insurers offer, so the reform should be phased in and monitored.
Site-neutral payment ends a quirk that lets hospitals charge Medicare, and patients, more for the same office visit or scan simply because a hospital owns the clinic. Patients’ coinsurance falls too.
Fossil fuel and farm subsidies are smaller but symbolically important. The oil and gas preferences mostly benefit large producers that are highly profitable at current prices, and crop insurance subsidies flow disproportionately to the largest farms and to the insurance companies that administer the program.
None of these reforms reduce benefits for lower-income households; the savings come from insurers, hospital systems, energy producers and large agricultural operations.
4. Spending Reductions That Spare Lower-Income Americans: $1.2 Trillion
The spending side of this plan centers on defense, the largest discretionary account, rather than on programs that support lower-income families.
| Reduction | Phase | 10-year savings |
| Cancel or retire lower-priority weapons: retire the F-22 and B-1B fleets, stop new Ford-class carriers after 2030, cancel the Long-Range Standoff nuclear cruise missile and the long-range assault aircraft | 1 | $85 billion |
| Reduce force structure and overhead by about half of CBO’s force-reduction option, which shrinks the military by 17% by 2034 or finds equivalent savings | 1 | About $575 billion |
| Complete the force-reduction option | 2 | About $570 billion |
| Total | About $1.23 trillion |
CBO estimates that a 17% reduction in military personnel, or equivalent savings elsewhere in the defense budget, would save $1.145 trillion over ten years. Spread across the decade, the full reduction would trim projected defense spending by roughly a tenth. The plan phases it in so the Pentagon can protect readiness, pay for junior enlisted members and priority investments while cutting overhead, contractor costs and legacy systems.
What this plan deliberately excludes
CBO’s menu also includes savings that would fall on lower-income Americans. This plan rejects them:
- Restricting Pell Grants to students eligible for the maximum award ($35 billion)
- Cutting transportation and education grants to states and localities by one-third ($390 billion)
- Halving Community Development Block Grants ($25 billion) and weatherization assistance ($5 billion)
- Cuts to Medicaid, SNAP, Supplemental Security Income, housing assistance, or the refundable portions of the Earned Income and Child Tax Credits
- Raising the Social Security retirement age, which falls hardest on lower-income workers, who on average live shorter lives
The plan also leaves international affairs funding intact; CBO’s option to cut it by a quarter ($215 billion) would undercut diplomacy and humanitarian programs whose savings are small relative to the gap.
5. Other Options and Later Phases
Phase 1 additions: $460 billion
- Collect taxes already owed: about $120 billion net. CBO estimated that $80 billion in added IRS funding would bring in about $200 billion over a decade, mainly from high-income filers and large businesses with complex returns. CBO’s current benchmark is that each added enforcement dollar returns about $6.40 over time.
- A 0.01% financial transactions tax: $340 billion. A charge of one penny per $100 traded falls mainly on high-frequency trading and large investors. Long-term savers who rarely trade would pay very little.
Phase 2, from 2030: $2.9 trillion
| Option | 10-year savings |
| A 1.5-point surtax on income above $100,000 single or $200,000 married | About $840 billion |
| Cap the tax exclusion for employer health insurance at the 75th percentile of premiums | $630 billion |
| Complete the defense force-reduction option | About $570 billion |
| Complete the Medicare Advantage coding adjustment | About $320 billion |
| Subject the charitable deduction to a floor of 2% of income | $350 billion |
| Limit very large retirement account contributions and Roth conversions | $195 billion |
Phase 2 reaches further into upper-middle incomes. The surtax applies only to income above the thresholds, so a married couple earning $250,000 would pay about $750 more a year. CBO scores each surtax point at $560 billion; the figure above scales that to 1.5 points.
Phase 3, from 2033: about 2% of GDP
The projections show that Phases 1 and 2 cut the deficit to about 3% of GDP but leave it there, because interest costs remain high. Closing the last gap requires a third set of measures worth about $1.1 trillion a year by 2040. Options that spare lower-income households include:
- A carbon fee with rebates. CBO scores a $25-per-ton fee rising 5% a year at $960 billion over ten years before rebates. Returning enough to hold the bottom 40% of households harmless would reduce the net savings.
- A minimum tax on billionaires that counts unrealized gains as income.
- Means-tested entitlement savings: higher Medicare premiums for high-income retirees, and slower growth of Social Security benefits for the highest lifetime earners only.
- Health care price reform: limits on the prices hospitals and drug makers charge across public and private insurance, which would slow the growth of Medicare and Medicaid costs.
The exact mix should be chosen by 2032 with updated CBO scores, so the plan can adjust to how the first two phases perform.
6. Putting It Together
Combined, the three phases cut projected deficits over 2027 to 2036 from about $25.5 trillion to about $12 trillion, hold debt near 95% of GDP in 2036 instead of 124%, and balance the budget in about 2045.
| Category | Phase 1 | Phase 2 | 10-year total |
| High earners and upper incomes | $3,135 billion | $1,385 billion | $4,520 billion |
| Corporations | $1,676 billion | None | $1,676 billion |
| Corporate subsidies | $1,337 billion | $320 billion | $1,657 billion |
| Defense | $660 billion | $570 billion | $1,230 billion |
| Tax enforcement and transactions tax | $460 billion | None | $460 billion |
| Employer health insurance exclusion cap | None | $630 billion | $630 billion |
| Subtotal | $7.3 trillion | $2.9 trillion | $10.2 trillion |
Add about $1.8 trillion from Phase 3 in 2033 to 2036 and about $1.5 trillion in lower interest costs, and total deficit reduction over the decade reaches about $13.5 trillion.
TAKE ACTION – Contact Congress

(How to contact Congress) click here
Congressional Committees That Oversee Federal Financing

🔹 Senate Committee on Finance
-
Senate counterpart to Ways and Means.
-
Jurisdiction includes:
-
Taxation, trade, and revenue
-
Debt management and entitlement financing
-
Oversight of Treasury, IRS, and Social Security/Medicare funding
-
🔹 Senate Committee on the Budget
-
Similar to the House Budget Committee.
-
Drafts budget resolutions, monitors federal debt, and analyzes economic forecasts.
🔹 Senate Committee on Appropriations
-
Controls federal spending through appropriations bills.
-
Influences federal financing indirectly by determining program-level budgets.
🔹 Senate Committee on Banking, Housing, and Urban Affairs
-
Oversees:
-
Federal Reserve System
-
U.S. financial markets and institutions
-
National credit policies and debt instruments
-

🔹 House Committee on Ways and Means
-
Primary tax-writing committee in the House.
-
Jurisdiction includes:
-
Federal revenue (taxation and tariffs)
-
Public debt (via Treasury)
-
Social Security and Medicare financing
-
Oversight of the IRS and the tax code
-
🔹 House Committee on the Budget
-
Responsible for:
-
Drafting the annual congressional budget resolution
-
Establishing spending and revenue levels
-
Long-term fiscal planning and federal debt oversight
-
🔹 House Committee on Appropriations
-
Controls discretionary federal spending.
-
Divided into subcommittees that allocate funds to federal agencies and programs.
-
Does not set tax or entitlement policy, but determines how money is spent.
🔹 House Committee on Financial Services
-
Oversees:
-
Federal Reserve System
-
U.S. Department of the Treasury (financial policy)
-
Public and private sector financial markets
-
National debt issuance and federal borrowing practices
-